$ curl -o /dev/null http://$GATEWAY_URL/productpagePrometheus
Before you Begin
-
Install Maistra by following the instructions here.
-
Deploy Bookinfo application by following these instructions.
Querying Metrics
-
Generate network traffic by accessing the Bookinfo application:
-
A route to access the Prometheus UI should already exist. Query OpenShift for details of the route:
$ oc get routes prometheus -n istio-system NAME HOST/PORT PATH SERVICES PORT TERMINATION WILDCARD prometheus prometheus-istio-system.127.0.0.1.nip.io prometheus http-prometheus None -
Open http://prometheus-istio-system.127.0.0.1.nip.io in a browser, you should see Prometheus' home screen, similar to this:
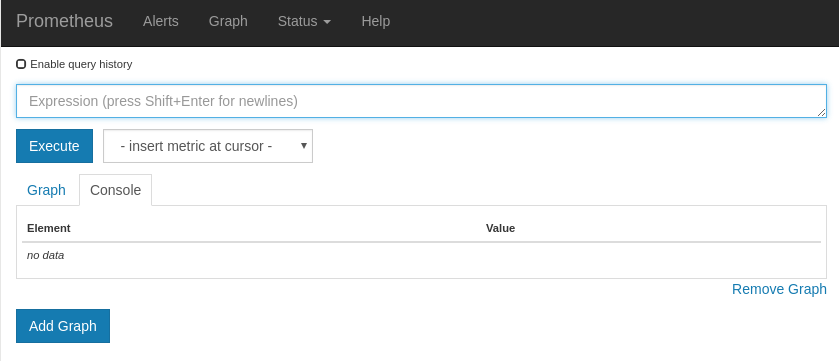
-
In the "Expression" input box enter
istio_request_duration_seconds_count, and click theExecutebutton. You should see a screen similar to this: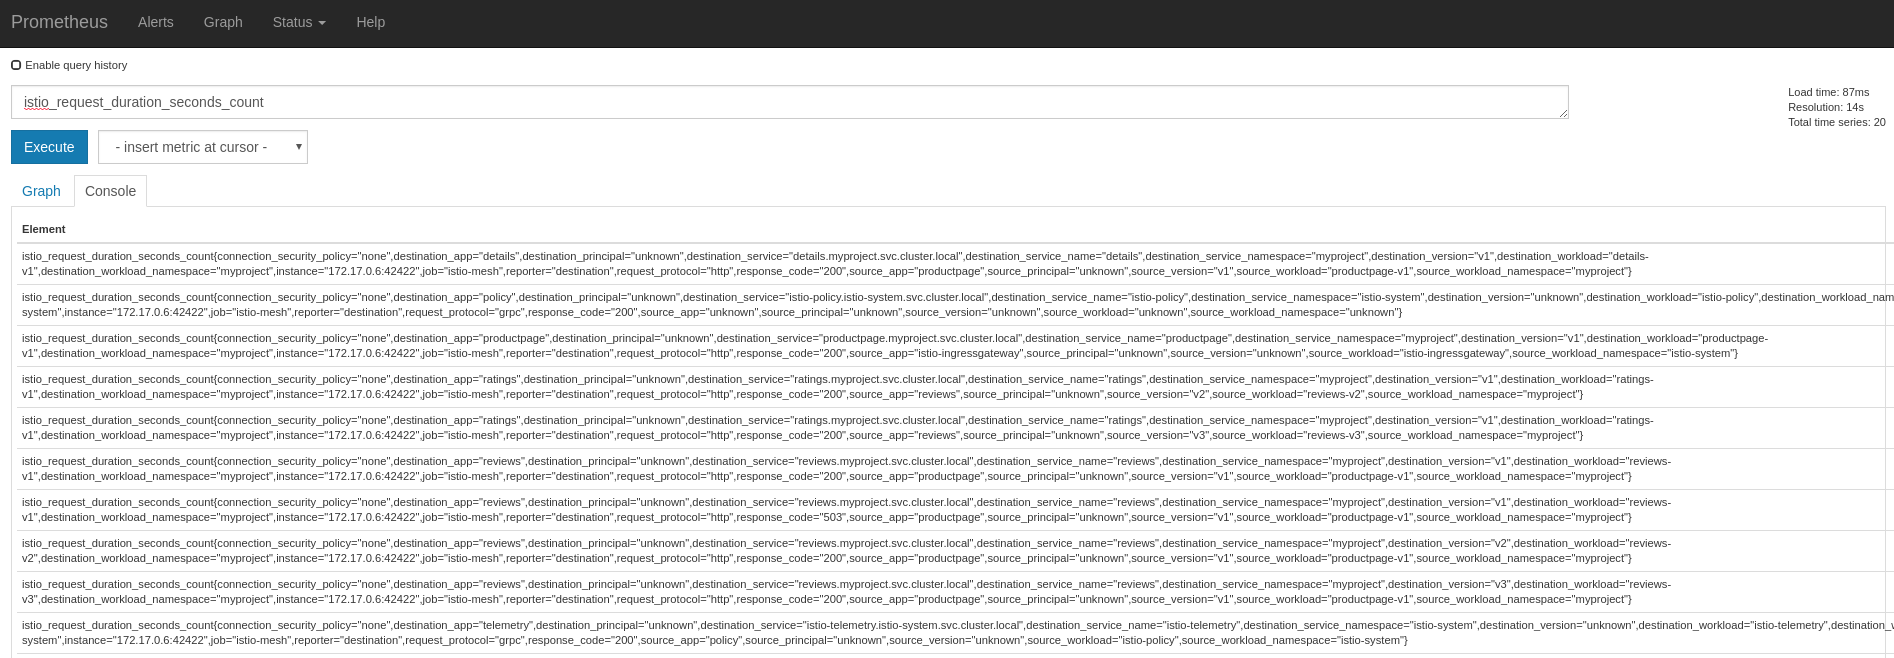
-
It is possible to narrow down queries by using selectors. For example
istio_request_duration_seconds_count{destination_workload="reviews-v2"}will only show counters with matching "destination_workload" label. For more information on using queries, please see Prometheus documentation. -
To list all available Prometheus metrics:
$ oc get prometheus -n istio-system -o jsonpath='{.items[*].spec.metrics[*].name}'
requests_total request_duration_seconds request_bytes response_bytes tcp_sent_bytes_total tcp_received_bytes_total
Note that returned metric names need to be prepended with
istio_when used in queries, e.g.requests_totalwill becomeistio_requests_total.
Cleanup
Follow Bookinfo cleanup instructions to remove the application.